Eric Murray, Spring 2006
Question these experiments will enable you to answer: What is the acceleration due to gravity?

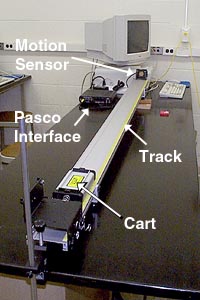
Features: The object is a cart on a track (a one-dimensional space). Automated measurements are made with devices that are interfaced to a computer and provide real time graphs of the motion. Acceleration values are obtained by finding the slope of the velocity vs. time graph. The track is converted to a ramp by raising one end by some suitable method and starting the cart from close to the high end of the track. The position and velocity as a function of time is measured at short time intervals by a motion sensor and recorded (and displayed in graphs) by the computer.
Preliminaries: Level the track. This can be done by gently rolling the cart in each direction, and seeing if the motion is the same each way. Set the track to its minimum slope. Record the height of the riser, and the distance between the track supports. Check that the motion sensor is at the end of the track and is pointing down it. Make sure the motion sensor is plugged in to channels 1 (yellow plug) and 2 (black plug) of the interface unit. Open the data template. You'll find graphs for both position and velocity as a function of time. The motion sensor has been set to record data at 25 Hz, beginning 20 cm from the motion sensor, and ending 160 cm away.
Experiment 1: Place the cart less than 20 cm from the sensor, make sure it can get to more than 160 cm from the sensor, click Record
, and release the cart. The motion sensor will begin to click rapidly once Record
has been selected, but no data will be recorded until the cart passes the 20 cm point. Position and velocity as functions of time will be plotted on the graphs.
Choose the velocity graph by clicking somewhere within its window. Fit a line to the data by choosing Linear: mt + b
from the Apply selected curve fits
menu. If there is questionable data at the beginning and/or end of the run, use the Highlight range
tool to highlight the valid linear data. The slope of this linear fit is the acceleration of the cart.
Find the acceleration of the cart for 10 trials. Find the average acceleration, the standard deviation, and the standard error. Calculate a value for the acceleration of gravity, with its standard error.
Experiment 2: Set the track to its maximum slope. Find the acceleration of the cart for 10 trials. Find the average acceleration, the standard deviation, and the standard error. Calculate a value for the acceleration of gravity, with its standard error.
Summary: Review your worksheet. Think about the goals of these experiments, your results, and the expectations from theory while writing your discussion.