Physics 2212, Lab 7: Resistance
Eric Murray, Fall 2006
Question these experiments will enable you to answer: Are the resistances of your resistors within the manufacturer's tolerance? How does light bulb's response to a potential difference compare to that of a resistor?
Features: Circuit elements to be investigated are resistors and a light bulb. Devices that are interfaced to a computer automate both the application of a potential difference, and the measurement of the resulting current. Resistance is calculated as the slope of the potential difference vs. current graph.
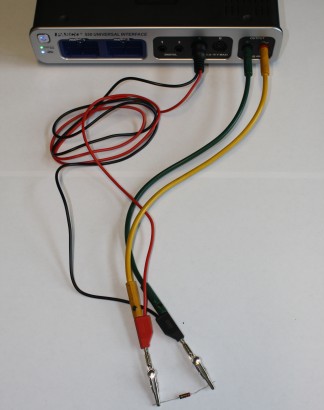
 Preliminaries: Build the 330 Ω resistor circuit. The potential difference is supplied by the "output" sockets, and measured by a "voltage sensor" in analog channel A. (The supplied current will be measured by the PASCO interface internally.) There are many valid ways to build this circuit, but an example is illustrated (and linked to a larger image). Open the data template. You'll find a graph for the potential across the resistor as a function of the current through it. (Remember that this is just a convenient way to find the resistance — the potential difference is actually the cause of the current flow.) The function generator is set to provide a potential difference that varies with time as a 1.0 Hz triangle wave having a 2.0 V amplitude. Data will be collected for 1.0 s after
 Record
is clicked, thereby recording one full cycle of potential difference. Nothing need be calibrated.
Experiment 1: Click Start
. Data will be collected for 1.0 s, and the best-fit line through the data will be displayed along with its parameters. Record the parameter corresponding to the resistance of your resistor. Repeat for each of the other two 330 Ω resistors at your station. If you delete the data after recording the resistance, so that each measurement is Run #1
, finding the best-fit line will be automatic.
After each measurement, calculate and record the average and the standard deviation so far. You may find an Excel spreadsheet to be helpful. Once you have measured all three of your resistors, pass them on to the next group, and get three new resistors from another group. Be sure to keep to a consistent pattern of passing on and getting resistors, as described by your TA, so that you never get the same resistors back again!
Record your standard deviations to two significant figures. Measure at least twelve resistances, and continue to measure resistances until your standard deviation so far has been the same for three consecutive trials. If you finish before other groups, you will need to continue passing resistors along.
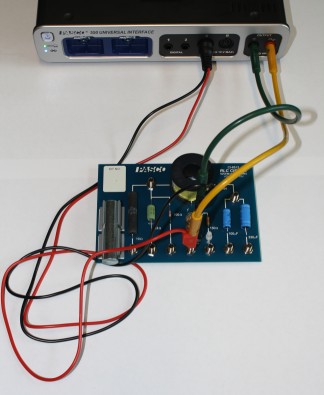
 Experiment 2: Replace the resistor in your circuit with one of the light bulbs on your board. There are many valid ways to build this circuit, but an example is illustrated (and linked to a larger image). Repeat experiment 1 for this single light bulb, recording the slope of best-fit line through your data.
Summary: Review your worksheet. Think about the goals of these experiments, your results, and the expectations from theory while writing your discussion.
 Preliminaries: Build the 330 Ω resistor circuit. The potential difference is supplied by the "output" sockets, and measured by a "voltage sensor" in analog channel A. (The supplied current will be measured by the PASCO interface internally.) There are many valid ways to build this circuit, but an example is illustrated (and linked to a larger image). Open the data template. You'll find a graph for the potential across the resistor as a function of the current through it. (Remember that this is just a convenient way to find the resistance — the potential difference is actually the cause of the current flow.) The function generator is set to provide a potential difference that varies with time as a 1.0 Hz triangle wave having a 2.0 V amplitude. Data will be collected for 1.0 s after