Physics 2212, Lab 5: Electric Potential and Field
Eric Murray, Fall 2006
Question these experiments will enable you to answer: What is
the arrangement of electric equipotential curves and field lines near an electric dipole?
Does the electric field magnitude along the line between the two charged particles of a
dipole vary linearly with 1 / x2 + 1 / (d - x)2 ?
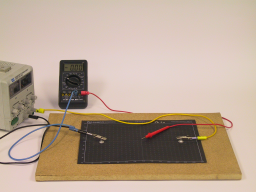
 Features: A sheet of slightly conductive paper upon which has
been drawn two solid circles (electrodes) in highly conducting ink represents a two-dimensional
cross section in the plane of an electric dipole. A power supply maintains a potential difference
between the electrodes, and a voltmeter is used to measure the potential difference between any
point on the paper and the negatively charged electrode.
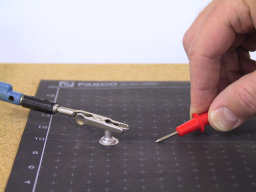
Preliminaries: Attach your conducting paper to the insulating
cork board with a conducting pin through each electrode. Try to center the pin on the
electrode. If there is already a hole through the center of the electrode, you should
re-use it. Push the pins into the cork board so that the head makes firm contact with
the electrode.
Connect the negative output of a power supply to the electrode at 4.0 cm, and the
positive output to the electrode at 24 cm. Connect the common socket of a DMM to
the negative electrode with a patch cord. Touching the DMM probe from the Volts
socket to the pin in the positive electrode, adjust the power supply until there is a
10 V potential difference.
 Experiment 1—Qualitative Equipotentials and Field:
Using the DMM probe, find the point along the line between the electrodes at which the
electric potential is 2.0 V. Do NOT poke holes in the paper!
Press the side of the tapered tip of the probe to the paper, so you will have good contact
without damaging the paper. Do NOT drag the probe along the paper!
Lift the probe tip before moving it to a different location. It shouldn't take long to narrow
the location down to the point where the electric potential is 2.0 V. Mark this location
on your map. Similarly, find the location(s) at which the electric potential is 2.0 V
at each possible even-numbered horizontal coordinate. Sketch and label a smooth curve through
these points, representing the 2.0 V equipotential curve.
Repeat for potentials of 3.0, 4.0, 6.0, 7.0, and 8.0 V. Points on the 3.0, 4.0, 6.0,
7.0 V curves should be plotted at each possible even-numbered vertical coordinate,
since these curves are likely to extend to the top and bottom edges of the paper.
Sketch and label six smooth lines representing electric field lines that extend from one electrode
to the other. Be sure to include one electric field line that leaves vertically up the page from an
electrode, and one that leaves vertically down.
Experiment 2—Quantitative Field Determination:
Find the electric potential at each centimeter mark between the electrodes. Calculate the
average electric field magnitude between each centimeter mark. Let x = 0 cm at the center
of the negative electrode, and d = 20.0 cm when calculating the value of 1 / x2 + 1 / (d - x)2.
Graph the calculated average electric fields as a function of
1 / x2 + 1 / (d - x)2.
Fit a straight line to the data. Report the slope with its uncertainty, and calculate the
charge on each electrode with its uncertainty. More importantly, be sure to look
at your graph, and think about whether the straight line fit is appropriate.
Summary: Review your worksheet. Think about the goals of these
experiments, your results, and the expectations from theory while writing your discussion.
 Features: A sheet of slightly conductive paper upon which has
been drawn two solid circles (electrodes) in highly conducting ink represents a two-dimensional
cross section in the plane of an electric dipole. A power supply maintains a potential difference
between the electrodes, and a voltmeter is used to measure the potential difference between any
point on the paper and the negatively charged electrode.
