Physics 2212, Lab 11: Induction
Eric Murray, Fall 2006
Question these experiments will enable you to answer: How does
the peak induced emf in the secondary coil of a transformer depend on the peak current
supplied to the primary coil, the frequency of the current supplied to the primary, and the
length of the primary within the secondary?
Features: An automated system will supply and record a sinusoidally
varying current to the primary coil of an air-core transformer. The system will record the emf
induced in the secondary coil. Sine functions will be fit to both the current and emf data so
the amplitudes (peak values) may be found.
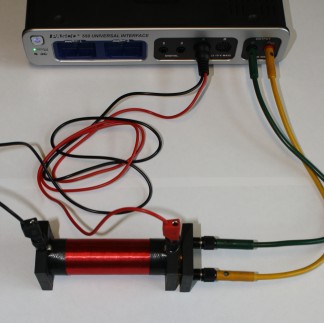
 Preliminaries: Current is supplied to the primary (narrow, inner)
coil by the
 output
sockets. Potential is measured across the secondary (wide, outer)
coil by a voltage sensor
in analog channel A. (The supplied current will be measured
by the PASCO interface internally.) Open the data template. You'll find graphs for the current through the primary and the
potential across the secondary as a function of time. The signal generator is set to provide
a potential difference that varies with time as a 5.0 kHz sine wave having a
0.050 V amplitude. Data will be collected for 0.004 s after Monitor
is clicked. Nothing need be calibrated.
Experiment 1 — Current Dependance: Click Start
. Fit
sine functions to the primary current and the secondary potential graphs. Record the amplitudes.
Repeat for a total of ten primary potential amplitudes, in 0.050 V increments. Find the
slope of the  s0 vs. Ip0 graph,
along with its uncertainty and correlation coefficient. You may find Excel to be helpful.
Note that the square of the correlation coefficient is roughly the fraction of the change in
  s0 that can be attributed to changes in Ip0.
Experiment 2 — Frequency Dependance: Set the Signal Generator
control to a 0.10 V, 1.0 kHz sine wave. Once again, click Start
and fit
sine functions to the primary current and the secondary potential graphs. Record the amplitudes.
Repeat for a total of ten primary potential frequencies, in 1.0 kHz increments. Since the
current does not remain constant, find the slope of the  s0 / Ip0 vs. f graph, along with its
uncertainty and correlation coefficient. Once again, you may find Excel to be helpful.
Important! Pay close attention to the fit sine curve that is displayed on your data.
Particularly at higher frequencies, the curve fit routine may find a sine function that does
not really fit your data. Make sure that the period of the fit to the induced emf data matches
the period of the fit to the supplied current data. If they do not match, try fitting a sine
series
curve to your induced emf data. This will fit the sum of two or more sine functions
to your data, and display information about each one. Choose the one with a period that matches
the period of the fit to the supplied current data. On rare occasions, none of the sine functions
will have a suitable period. In that case, try recording a new set of data for that frequency.
Experiment 3 — Length Dependance: Set the Signal Generator
control to a 0.20 V, 5.0 kHz sine wave. With the primary coil fully within the
secondary, click Start
and fit sine functions to the primary current and the secondary
potential graphs. Record the amplitudes. Repeat for a total of ten measurements, withdrawing
the primary 1.0 cm each time. Although the current shouldn't vary as much as it did when
the frequency dependance was investigated, it may still vary a little. Therefore, you should
graph  s0 / Ip0
vs. various functions of length (1 / l2, 1 / l,
l, and l2 are suggested). Report which function has a linear
relationship, along with the uncertainty and correlation coefficient for that function.
Excel may still be helpful.
Summary: Review your worksheet. Think about the goals of these
experiments, your results, and the expectations from theory while writing your discussion.
 Preliminaries: Current is supplied to the primary (narrow, inner)
coil by the
  s0 vs. Ip0 graph,
along with its uncertainty and correlation coefficient. You may find Excel to be helpful.
Note that the square of the correlation coefficient is roughly the fraction of the change in