Eric Murray, Fall 2020
Data: The motion sensors record the velocities of the two carts. Consider this example for experiments 1 and 2:
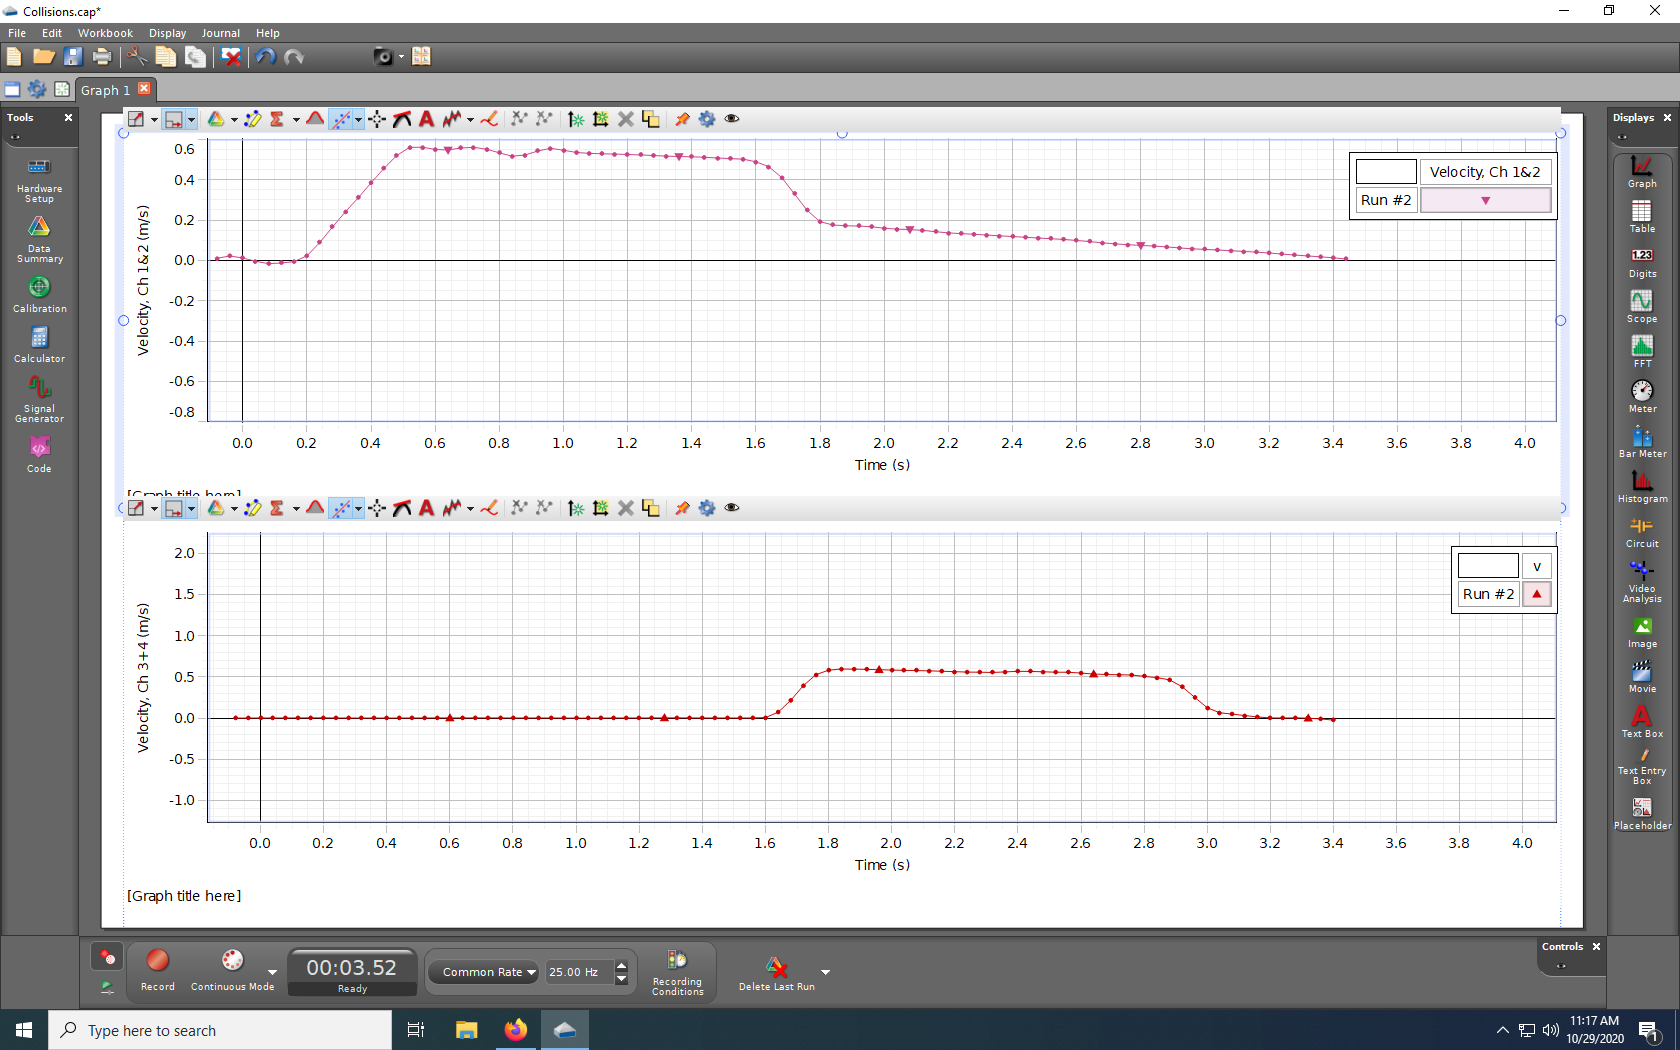
The upper graph shows the velocity of the left (shoved) cart, and the lower graph shows the velocity of the right (initially stationary) cart. Note that the speed of the left cart is decreasing, even before the elastic collision, due to friction. The point of experiment 1 is to show that friction is significant. In experiment 2, the effect of friction is taken into consideration.
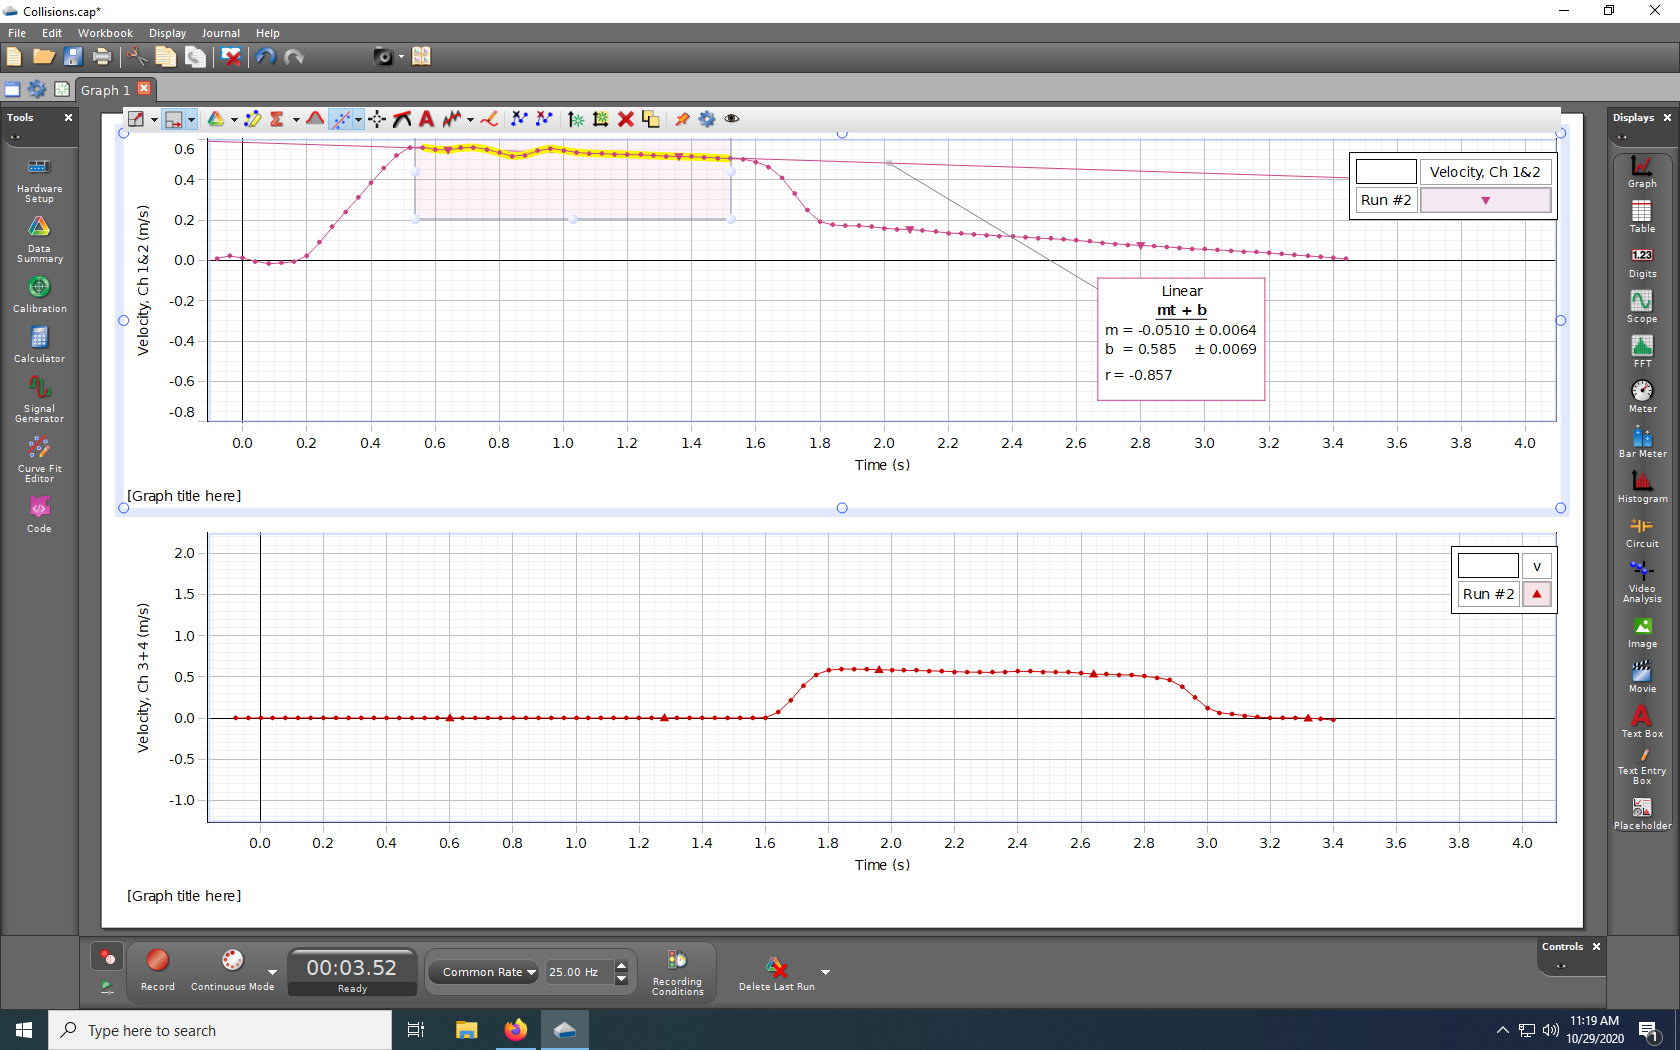
Accounting for Friction: The best-fit line through the left cart's velocity data before the collision is determined.
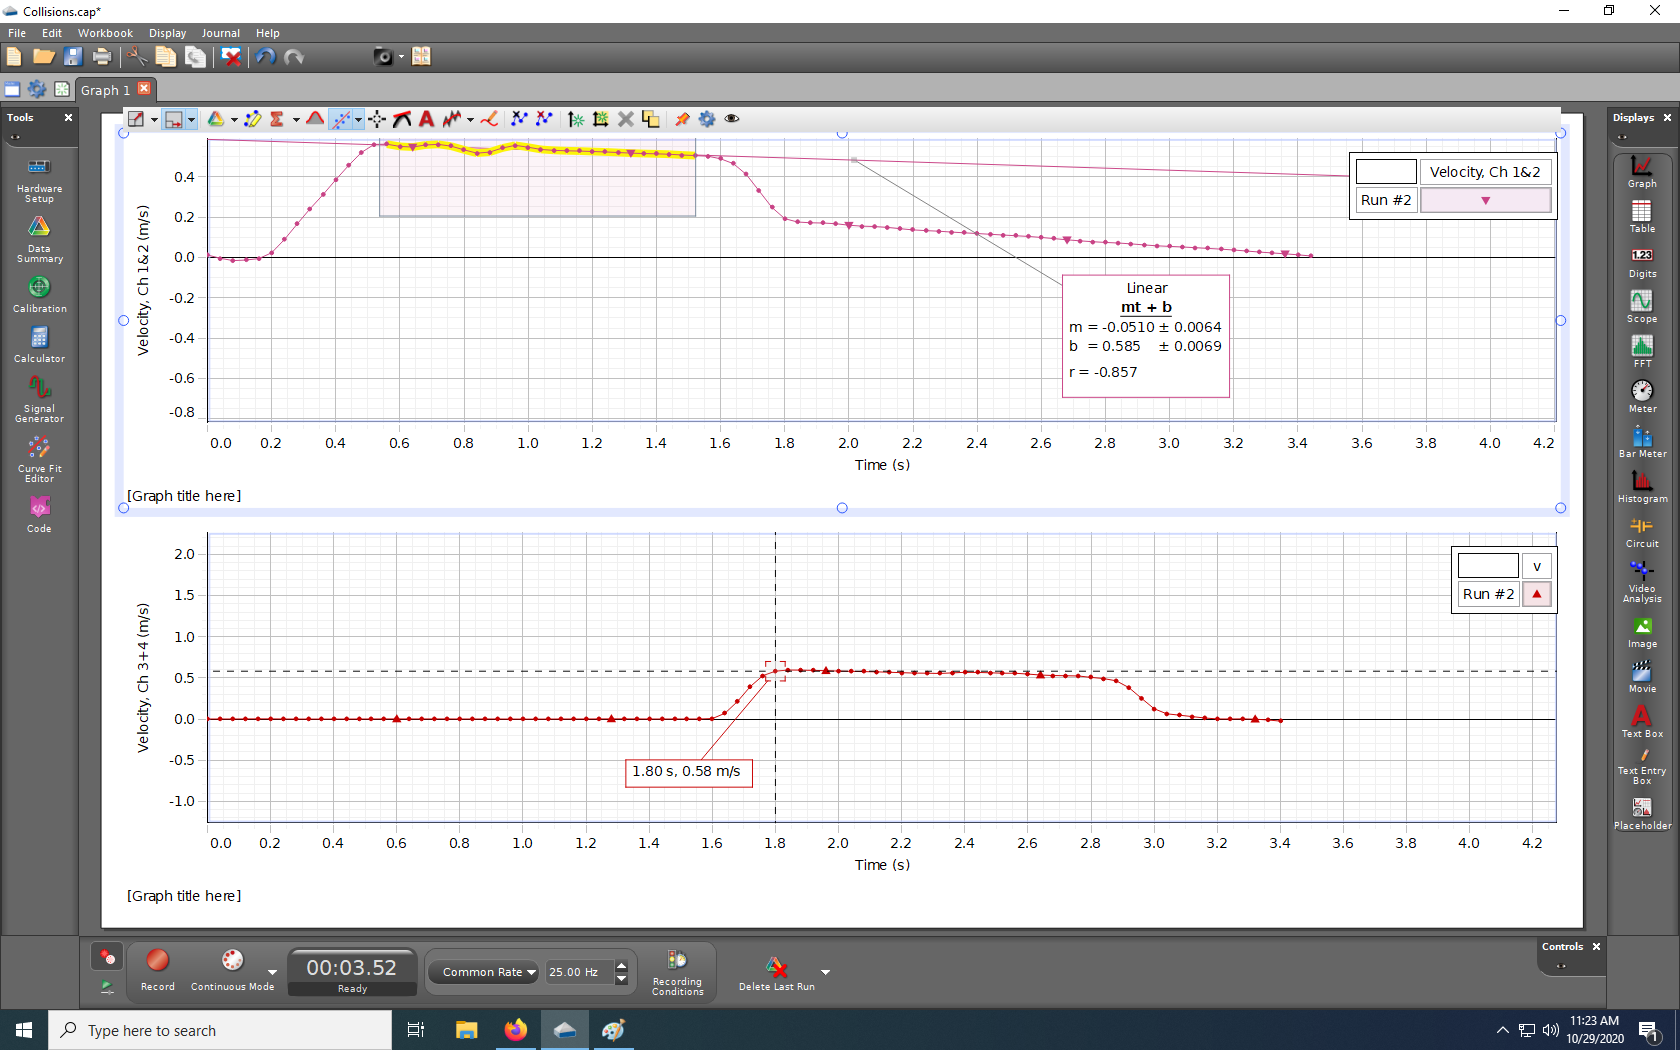
The time at which the right cart achieves maximum speed is the after
time for the collision. While its speed is increasing, it still under the influence of the left cart—this is during
the collision. When its speed begins to decrease, the left cart is no longer influencing it, and the friction force is more significant—this is after
the collision.
This time should be substituted into the equation of the best fit line to find the velocity the left cart would have had at the after
time if there had been no collision! Using this for the initial velocity of the left cart compensates for the effect of friction on the left cart.
Because the effect of friction has been considered, if your expermental results differ from theory, you'll want to think very carefully about any shortcomings in this analysis before attributing the difference to friction.